Features
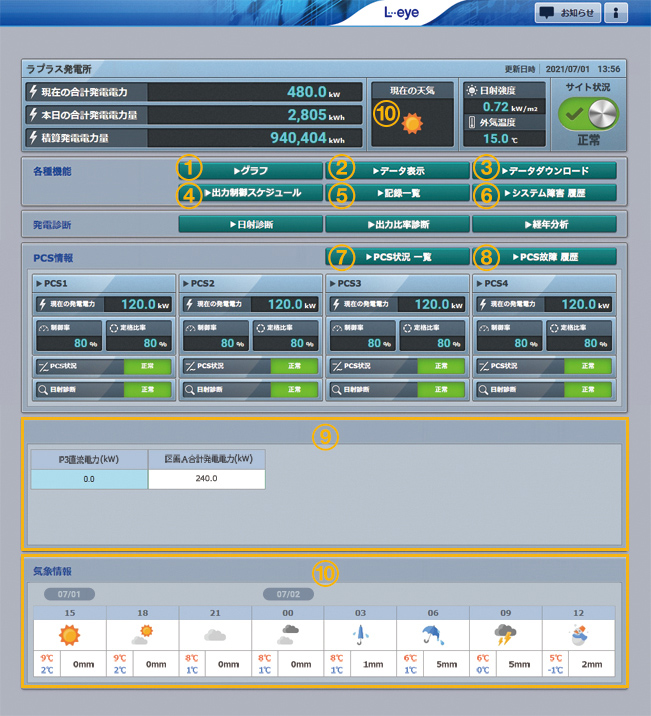
■Basic Features
1.GraphTrends in power generation, etc. can be displayed in different modes, such as "Inverter Graph," "String Graph," and "Output Curtailment Graph," depending on the measurement item and content.
2.Data Display
Check the amount of generated power, solar radiation, and temperature data in graphs and reports.
3.Data Download
The measured data can be downloaded in CSV format.
4.Output Curtailment Schedule
You can check the output curtailment schedule, and by clicking the control rate on the calendar, a detailed schedule will be displayed. You can also check the output curtailment history.
5.Record List
You can register information necessary for site management.
This is useful for recording maintenance work, etc.
6.System Failure History
You can check the history of failures and recovery between measuring devices and servers, and download the data in CSV format.
7.Inverter Status List
The current voltage, current, and power values of each inverter, the daily accumulated power generation value, and the operating status are displayed.
8.Inverter Failure History
You can check the detailed fault occurrence and recovery history of the inverter and also download it in CSV format.
You can also be notified by email in the event of the inverter failure.
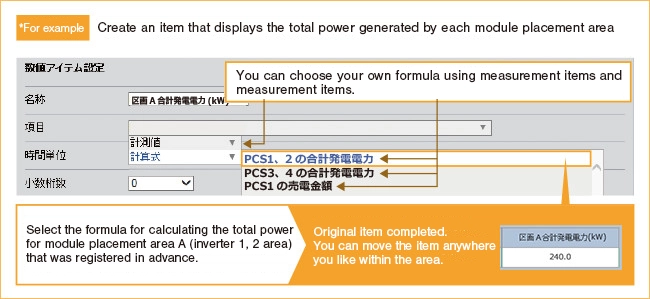
9.Flex Area
This area allows you to add or delete any measurement values you want to display, and arrange them in a layout.
10.Weather Information
You can view the current weather and weather forecast (today and tomorrow).
*Customers will need to configure this setting.
*This may not be available on some sites.
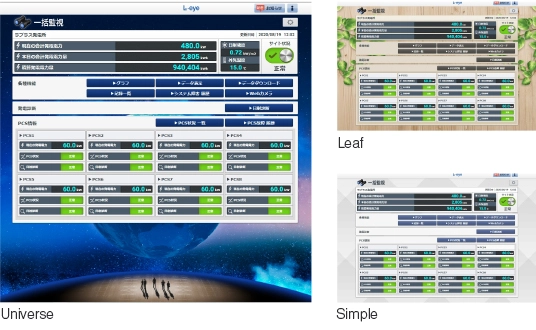
Three new patterns have been added to the monitoring screen design.
You can choose your favorite design and set it freely.
*You will need to obtain a Laplace ID.
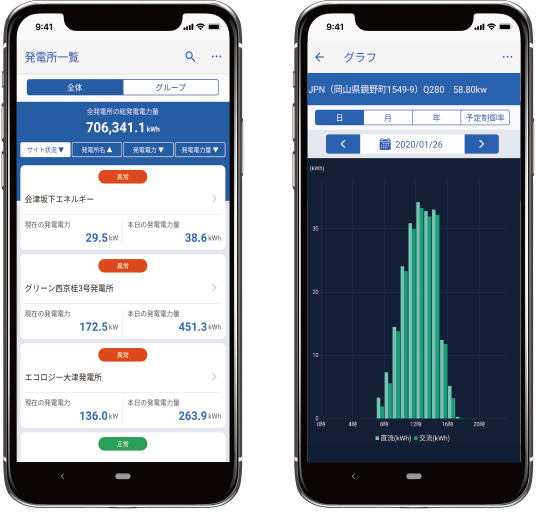
Check power generation status anytime, anywhere with your smartphone.
The easy-to-read design and high level of operability that only an app can provide enable smooth remote monitoring.
■Optional Features
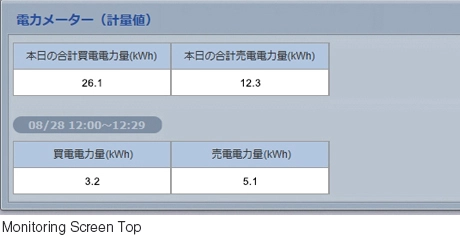
Information obtained from smart meters (low voltage and high voltage) and certified electricity meters is displayed.
You can also download it in CSV format.
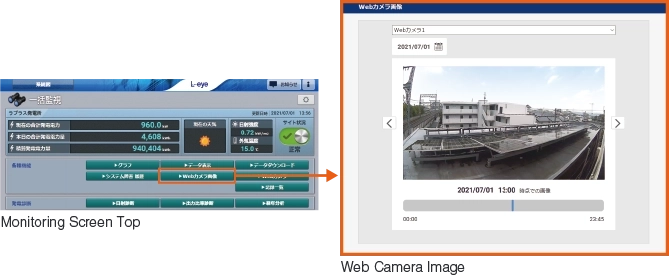
A single measuring device configured as an L・eye can perform both measurement and image acquisition.
The captured images are stored for 31 days, allowing you to look back and check on-site conditions.
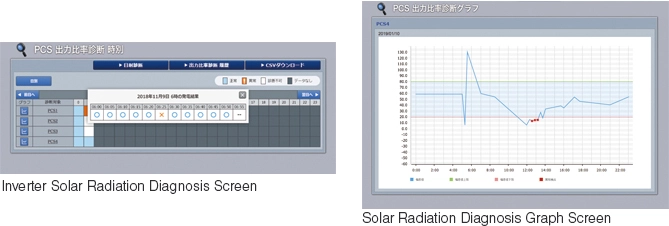
It diagnoses whether power generation is equivalent to the solar radiation intensity on an inverter or string basis.
Past measurement data is subjected to regression analysis to calculate the estimated amount of power generation according to the amount of solar radiation. The ratio of the actual amount of power generation to the estimated amount of power generation is output as a "power generation index," and a threshold is set to display any abnormalities.

The normal range of power generation is determined from the output ratio of each inverter string to the total, and a diagnosis is made for each time period to see if power generation is correct or not (patented).
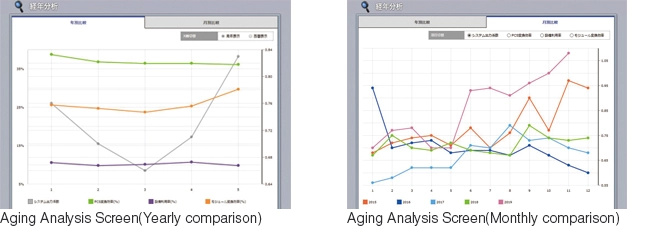
Calculates system output coefficient, capacity factor, inverter conversion efficiency, and module conversion efficiency to display the aging of the plant.
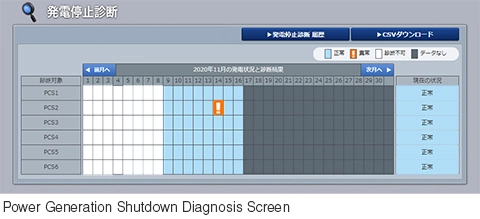
For all inverters in the power plant, if power generation remains at 0kW for a longer period than the set time, a power generation stop is detected.
A list of receiving and transforming equipment items is displayed at the top of the monitoring screen, and email notifications are also sent.

When the motion sensor detects an intrusion, it will scare off the intruder with a rotating light with siren and an LED light. It will also notify you of the abnormality by email. The history of abnormality detection such as intrusions can be checked in the item list of the substation equipment area.

The string status is displayed at the top of the monitoring screen and you can check and download detailed information for each string.

You can grasp the situation from various perspectives, such as the overall status of all your power plants, each group, or each power plant. You can transition to the individual monitoring screens for each power plant, and in the event of an abnormality, you can smoothly check the situation in more detail.
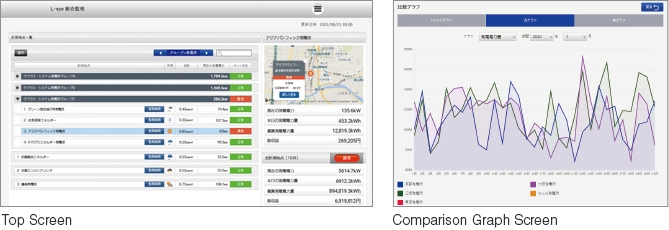
When measurements are taken at multiple sites, they can be monitored as a group and the total amount of power generated at each site can be checked. In addition, the measurement data for each site can be downloaded in CSV format.
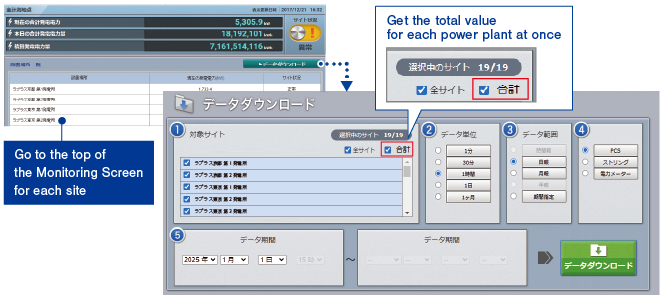
Data Download Screen
You can select from the target sites and download the measurement data all at once.
If multiple inverters, power meters, etc. are installed, checking "Total" will allow you to download a CSV of the total values for each power plant.
*Can also be obtained via API.
Each site in your group can be monitored in list format and location information is displayed by placing a pin on the map at the power plant's location.
*Click on the pin on the map to check the amount of power generated, etc.

Against a background of eye-catching design, measurements such as power generation and graphs are displayed in an easy-to-understand manner.

You can easily obtain measurement data and use it to create your own applications. *When you enter a specified URL and send a request to our server, XML format data will be returned as a response.
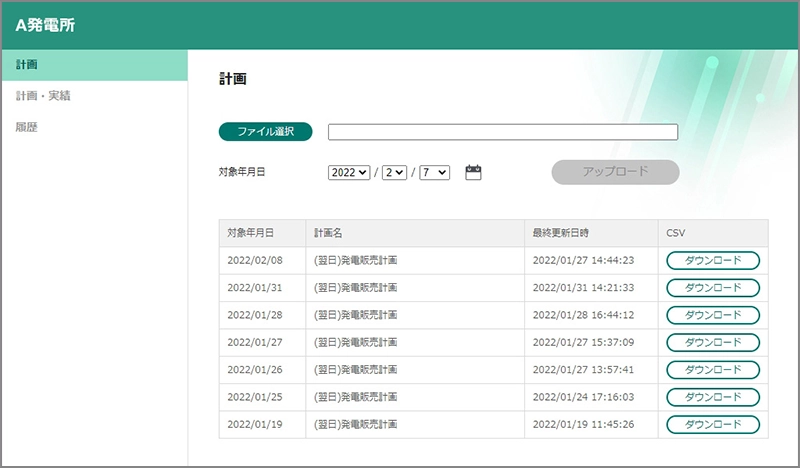
The inverter is controlled based on the power generation plan created and uploaded by the customer.
You can check the planned values, actual values, and update history.
*We do not guarantee that the planned power generation value and the actual power generation value will be controlled to be the same.
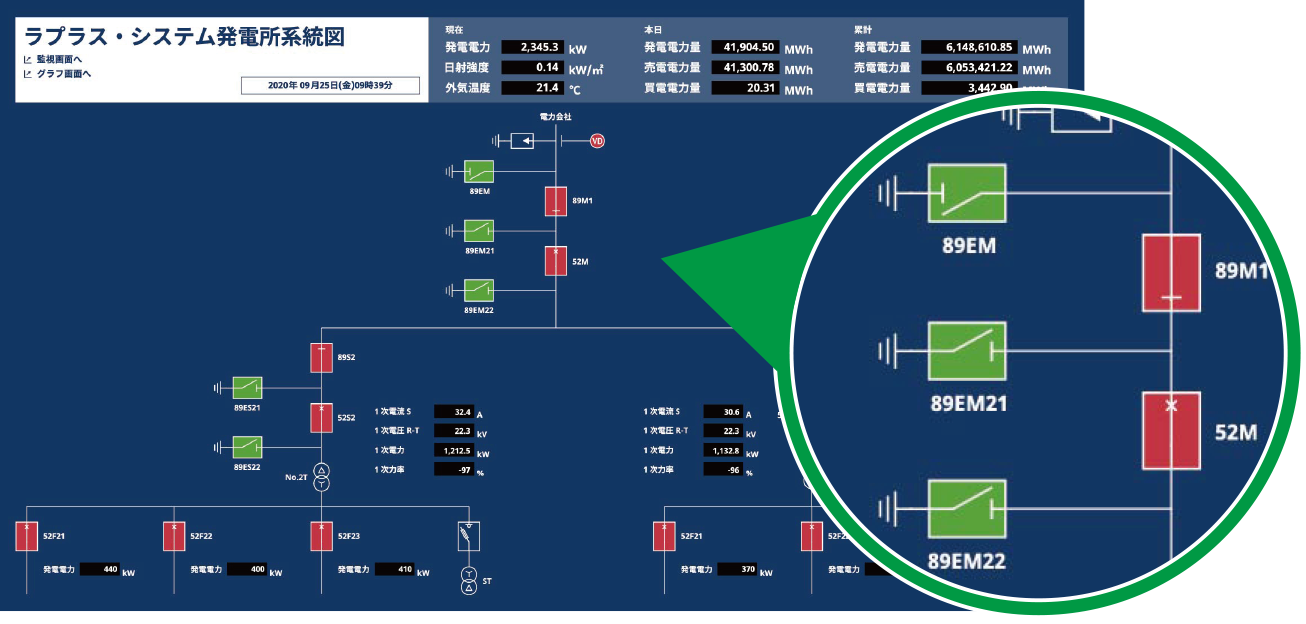
Created based on the single-line diagram provided by the customer.
This allows for an intuitive understanding of the operating status of the entire power plant and also helps pinpoint the location of any abnormalities.
*Image is for illustrative purposes only.
The inverter can be switched on/off remotely via measuring equipment.
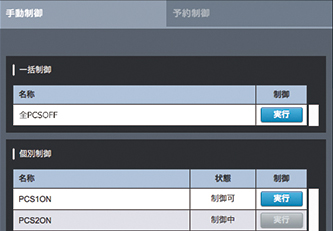
You can set up reservation control by selecting the target inverter and date and time.

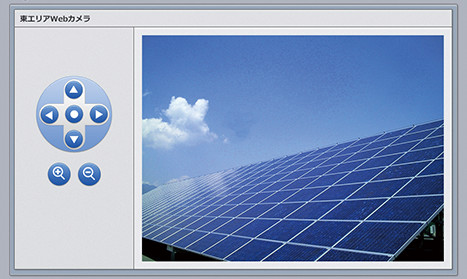
You can check the situation around the power plant in real time.
It can be easily installed using the "Web Camera Set" which includes a web camera and necessary equipment.
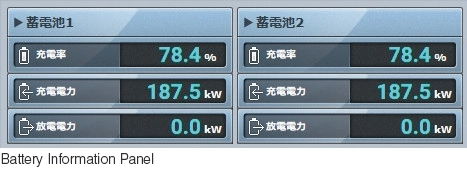
Battery measurement data (charging rate, charging power, discharging power) can be displayed.
Battery measurement information can also be downloaded in CSV format.
Supported Environment
PC
We have not verified viewing or operation in other environments.
| Supported OS | Windows 11 |
|---|---|
| Supported Web Browsers | Google Chrome / Mozilla Firefox / Microsoft Edge(All latest versions) *The graph screen may not be displayed correctly on browsers other than those listed above. |
| Screen resolution | 1280 x 1024 pixels or higher is recommended (1024 x 768 pixels can also be used) |
Smartphones and tablets
Operation has been confirmed under the following conditions. Operation on your computer may differ even in an environment where operation has been confirmed.
Please note that optional functions other than the remote control function have not been confirmed to work.
| iPhone / iPad | iOS 18 / iPadOS 17:Safari Latest version |
|---|---|
| Android | Android14:Google Chrome Latest version |



If continuous power generation is not confirmed despite the presence of sufficient solar radiation, an abnormality is displayed.