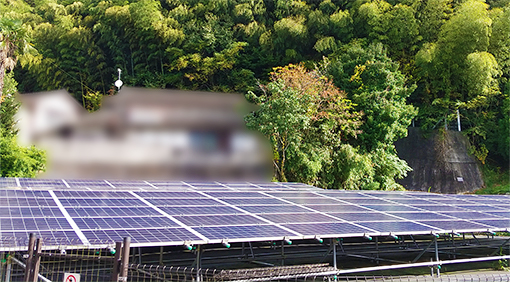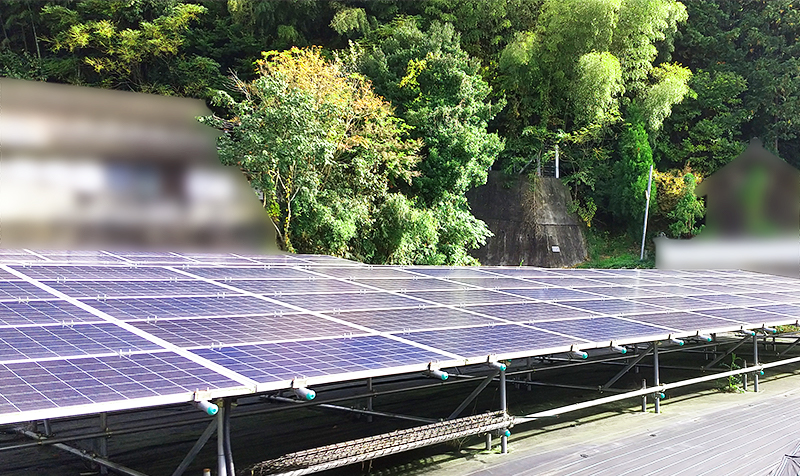
Mr. N is engaged in the power generation business in Ayabe City, Kyoto Prefecture.
He told us about the background to the introduction of L・eye, how he discovered problems at his power plant through remote monitoring,
and how he uses the functions.
Q1.Thoughts on starting a photovoltaic business
Q2.The reason for introducing L・eye
Q3.Awareness of problems at power plants
Q4.How to use the function
Q5.Future Plans

Since I was an ordinary office worker with no particular knowledge, I had a hard time filling the mental gap at first. I had high expectations, but I remember feeling more anxious about what to do in the future, what to do if something happened, and so on, especially in terms of finances, because my sense of money was changing so dramatically.
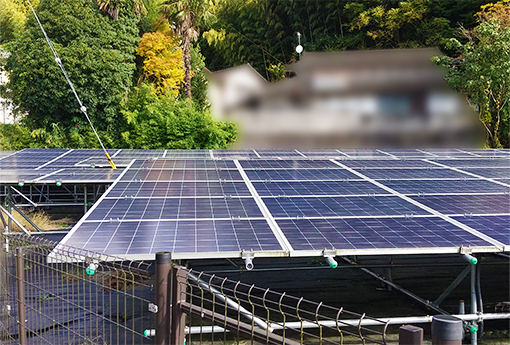

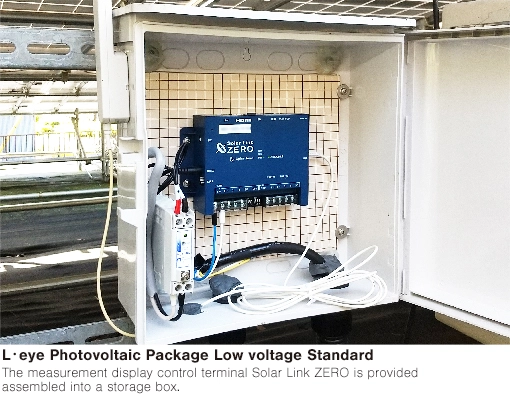
I knew that I had to avoid a situation where I would not notice the problem until I checked the power company's electricity sales slip, resulting in a major loss in sales. Also, since it was the first power plant I owned, I was interested in how my power plant would behave, so I asked the construction company to retrofit a monitoring device. That was how I encountered L・eye.
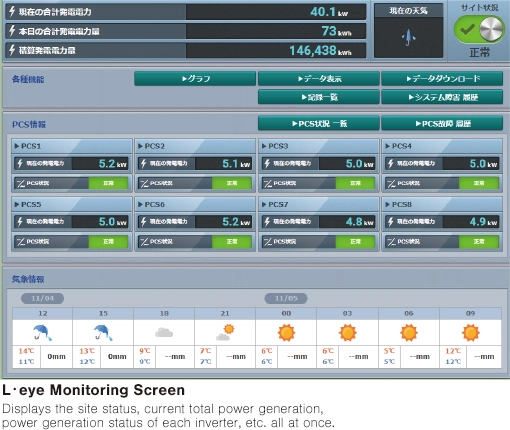
The sales company also handled monitoring systems from other companies, but those only allowed me to check the total amount of power generated, so the fact that I could check the amount of power generated by each inverter was the deciding factor in choosing L・eye.

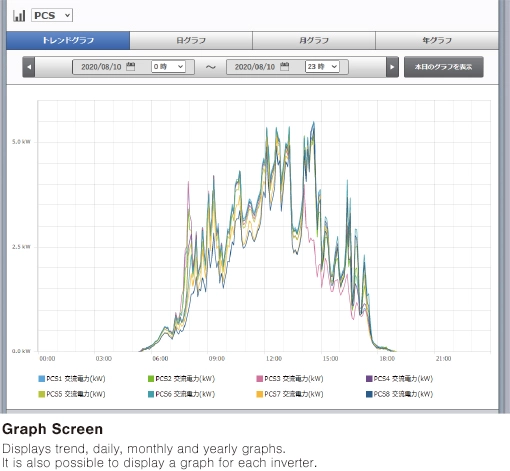
For the first month, I couldn't take my hands off my smartphone, smiling when I saw the amount of power generated on the home screen and enjoying the graph that increased day by day.
I think it started around August, about three weeks after the power plant was connected to the grid. Every time I looked at the home screen or the graph screen, I began to feel like "Isn't the amount of power generated by my power plant lower than expected?"
At first it was a small difference, but with each passing day, my doubts turned into certainty, and I realized that this power plant was not generating as much power as expected.
After that, the problem was solved thanks to the support of the distributor. L・eye is helpful in solving such difficult problems.

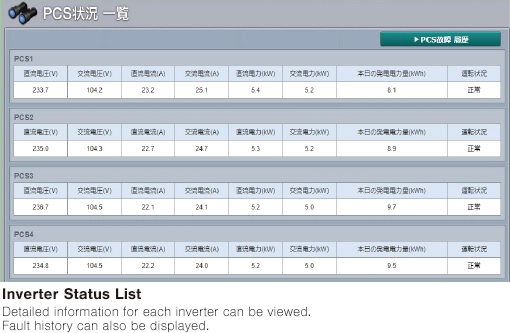
The inverter status list displays the AC/DC voltage, current, and power of each inverter in real time and accumulates history. By verifying this data, detailed information such as:
- Suppression of voltage rise
- Confirmation of suppression of temperature rise
- Conversion performance of the power conditioner
- Power generation status of each power conditioner
can be cross-checked, making it a powerful tool for isolating problems at power plants.
The data itself is also persuasive when explaining to a third party.

I think it would be even easier to use if the time limit for downloading CSV data was removed in the future. For example, monitoring data in one-minute increments can only be downloaded on a daily basis, so to download data for a year, the download operation would have to be performed 365 times, which is quite a hassle. I look forward to future expansion of functions.
I plan to continue using L-eye, which is not only useful as a monitoring device for everyday enjoyment, but also as a useful tool for discovering and solving any problems that may occur.
