L・eye monitoring screen demo site
Hover the mouse cursor over a number to see a description of its function.
|
|
|||||||||||||||||
|
|

|
||||||||||||||||
|
|
|
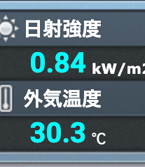
You can display the current weather at the set observation location, as well as forecast information for every three hours from the time of operation. |
|
 |
You can see the operation status of the entire facility. 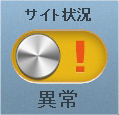
|
|
|
|||||||||
|
|
 |
|
 |
|
|||||||||||||
|
|
Displays graphs for inverters, strings, output control, power buying and selling, etc. In addition, if both the amount of power bought and the amount of power sold are measured using metered values, a graph of the amount of power bought and sold (metered values) can also be displayed. |
|
You can check data on power generation, solar radiation, temperature, and planned control rate in graphs and reports. |
|
Measurement data can be downloaded in CSV format. |
|
|
||||||||||
|
|
You can check the history of failures and recovery between the measuring device and the server, and download the history in CSV format. You can also receive email notifications when a failure occurs. |
|
Images captured by the camera are stored for 31 days and can be reviewed going back in time. |
|
You can check the situation around the power plant in real time. You can freely operate the camera with the zoom, tilt and pan functions. |
|
|||||||||||
|
|
|
You can check the Output curtailment schedule, and by clicking the control rate on the calendar, a detailed schedule will be displayed. You can also check the output control history. 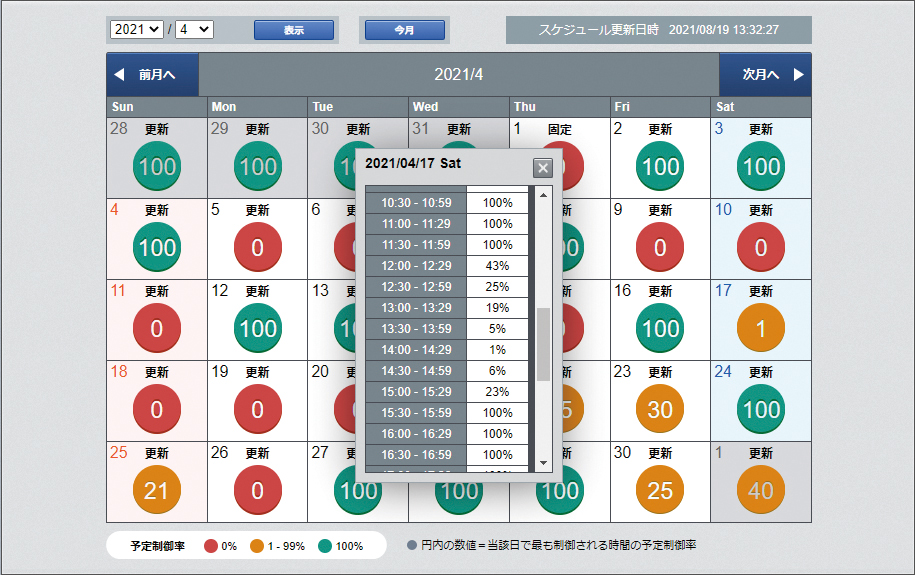
|
|
You can register information necessary for site management, which is useful for recording maintenance implementation records, etc. |
|
||||||||||||
|
|
It diagnoses whether power generation is equivalent to the solar radiation intensity on an inverter or string basis. |
|
The normal range of power generation is determined from the output ratio of each inverter string to the total, and a diagnosis is made for each time period to see if power generation is correct. 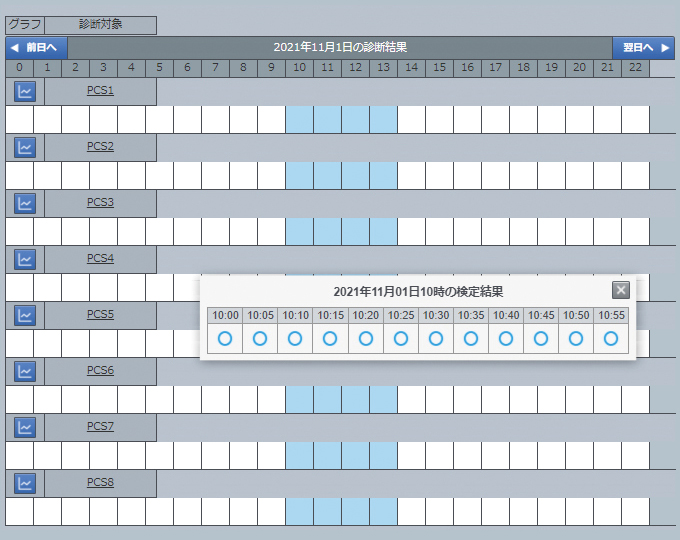
|
|
It calculates the system output coefficient, facility utilization rate, inverter conversion efficiency, and module conversion efficiency, and displays the aging changes of the power plant in a graph. |
|
|||||||||||
|
|
|
|
|
|
|
||||||||||||
|
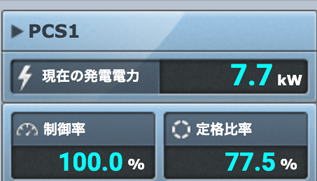
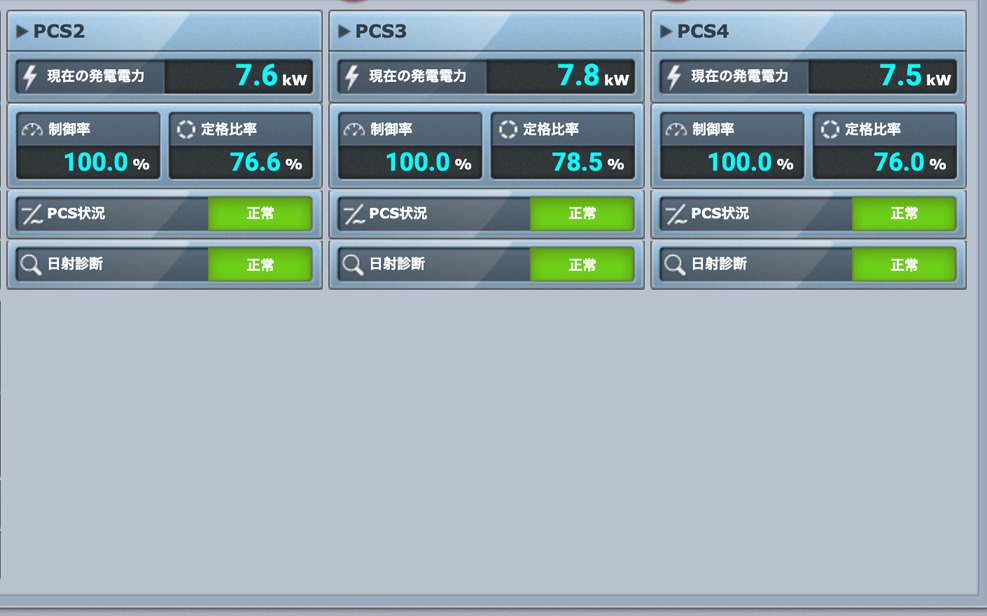
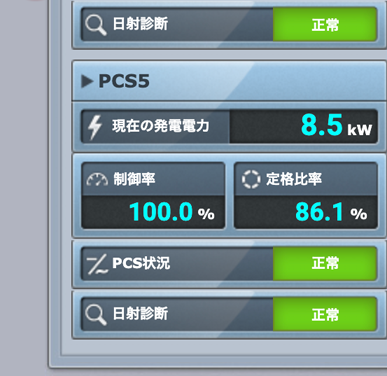
You can check the current voltage, current, and power values of each inverter, the daily integrated generated power, the control rate of output control, the rated ratio, and the operating status. |
|
You can check the detailed fault occurrence and recovery history of the inverter and download it in CSV format. You can also receive email notifications when the inverter fails. |
|
||||||||||||||
|
|
Displays the output control status of each inverter based on the output control schedule provided by the power company. Control rate: Inverter control rate Rated ratio: The power generation ratio of each inverter to its rated capacity |
|
|
||||||||||||||
|
|
|||||||||||||||||
|
You can see the operating status of each inverter, the results of power generation diagnosis, and the string status. 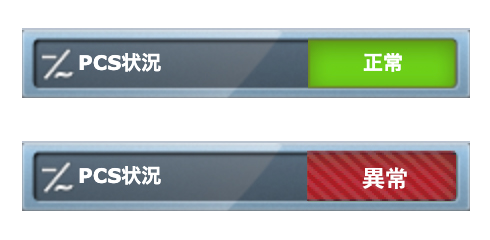
|
|
||||||||||||||||
|
|||||||||||||||||
|
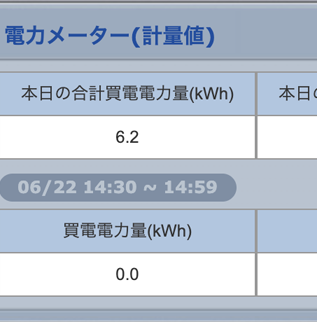
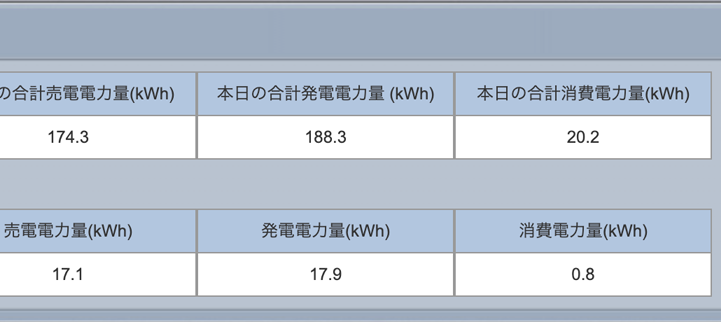
When measuring with a certified electricity meter, the measurement data of the smart meter (low voltage/high voltage) and the measured value of the certified electricity meter will be displayed. It can also be downloaded in CSV format. |
|
|
|
In addition to the existing display items, this area allows you to freely add and arrange measurement values and status displays that you want to add. 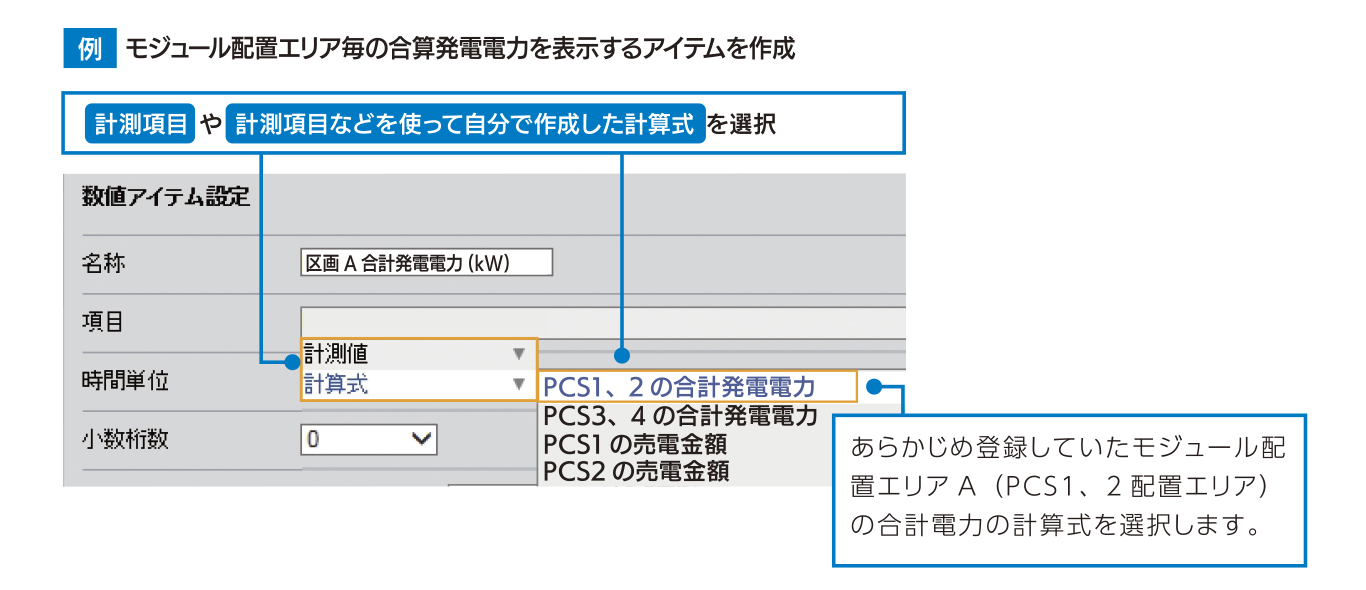
|
|
||||||||||||
|
|

|
|
|
||||||||||||||
|
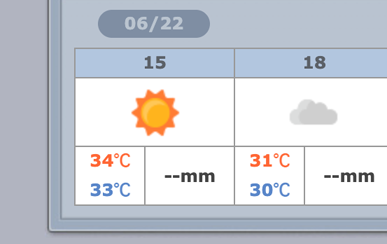
You can display the current weather at the set observation location, as well as forecast information for every three hours from the time of operation. |
|
|
|||||||||||||||
|

|
||||||||||||||||
|
|
|
|
|
|
|
|
|
|
|
|
|
|
|
|
|
|
|
Experience the L・eye monitoring screen