Comprehensive Monitoring
Multifaceted Insight Unique to Comprehensive Monitoring
You can monitor the status of your entire solar power portfolio from various perspectives—such as all owned sites, by group, or by individual power plant. You can also seamlessly access each plant’s L・eye monitoring screen for detailed status checks in the event of an alert or abnormality.
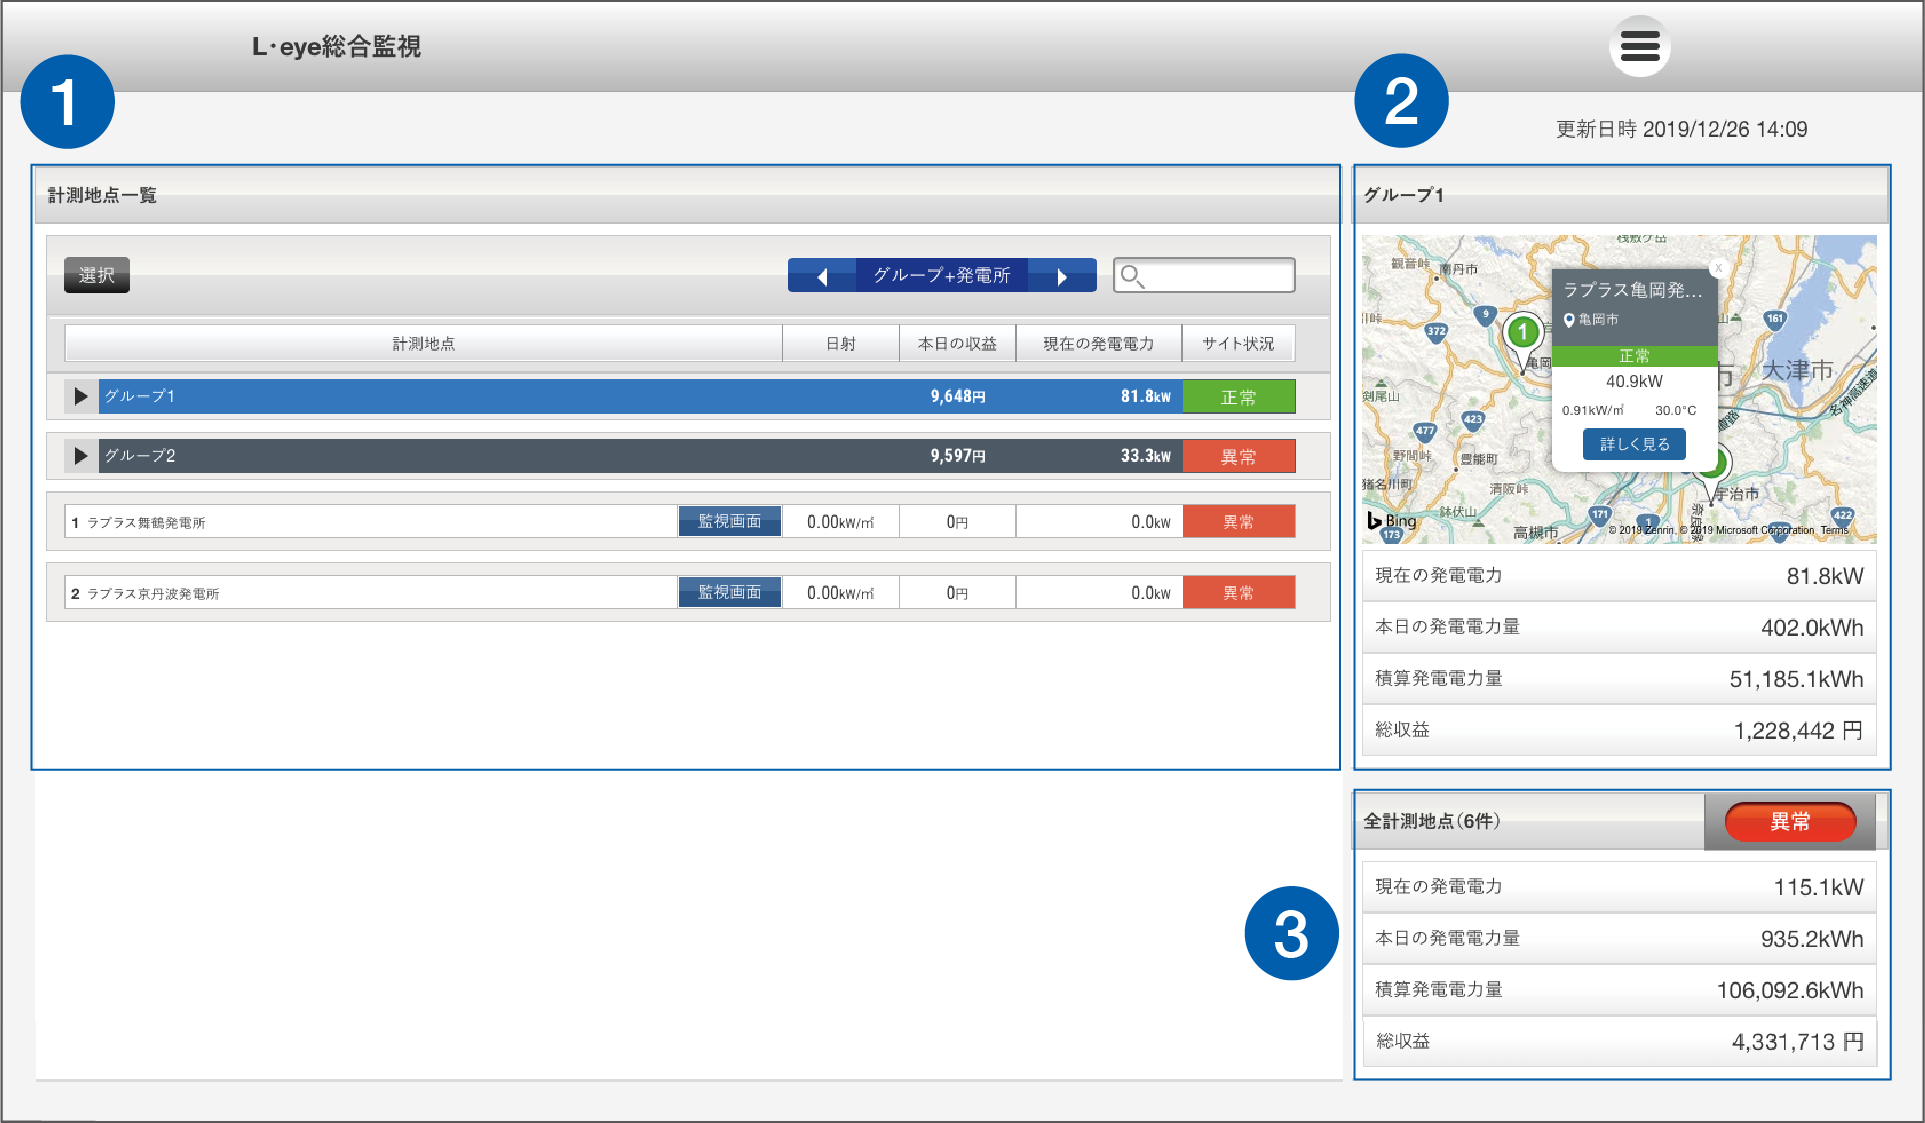
A list of pre-configured measurement points will be displayed.
Measurement Site List
Registered measurement points are listed and can be
filtered in three display modes:Group + Plant, Group, and Plant.

Sorting Function
You can sort by each column or parameter.

Search Function
The number of hits matching the search keyword is displayed, and matching items are highlighted.

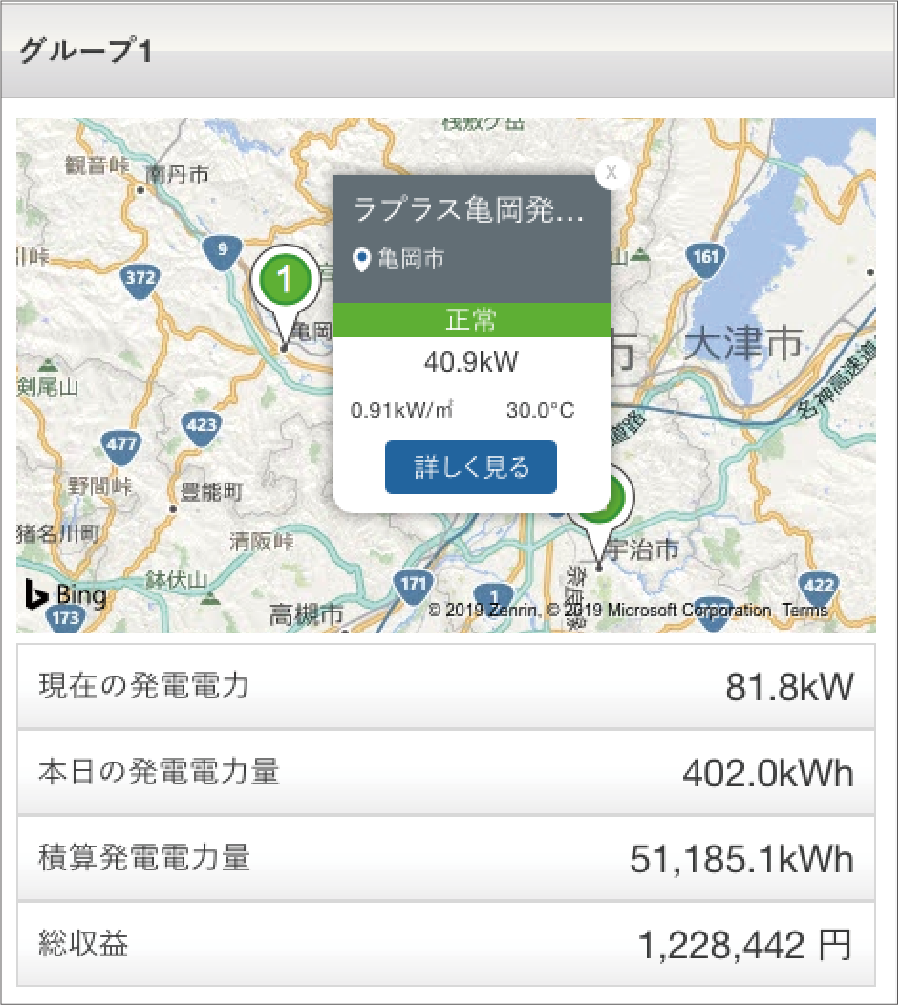
Displays data for the group or plant selected from the Measurement Site List.
Power Generation amount Sitemap
Displays the location of the selected power plant in map format. Clicking on a pin shows generation status and provides a link to the L・eye monitoring screen.
Detail View Area
Displays total values for the selected group or power plant.
- Current Power Output
- Today’s Power Generation amount
- Cumulative Power Generation amount
- Total Revenue
Displays the total, status, and number of all power plants listed in the measurement point list.
- Current Power Output
- Power Generation Amount Output (Monthly/Daily)
- Cumulative Power Generation amount
- Total Revenue
Site Status
If even one power plant among all sites has an abnormal status, you will be notified.

Comparison & Aggregation
Versatile Features to Expand Usability
Packed with a wide range of features that support various uses, including comparison between power plants and saving generation data.
Graph
You can display comparison graphs for up to 30 power plants simultaneously.
Additionally, you can check the total power generation amount graph for selected power plants.
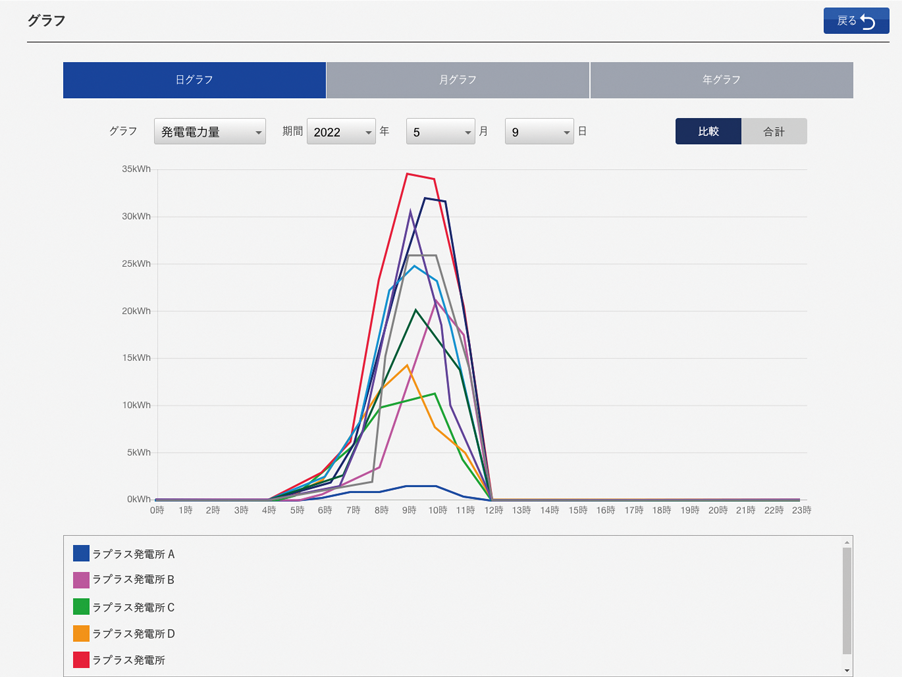
- Power Generation amount
- Solar Radiation
- Temperature
- Electricity Sales Revenue
- Power Generation amount & Solar Radiation
Data Download
Download measurement data for each power plant in CSV format.
You can specify data unit, data range, period, and measurement targets.
- Daily Report
- Monthly Report
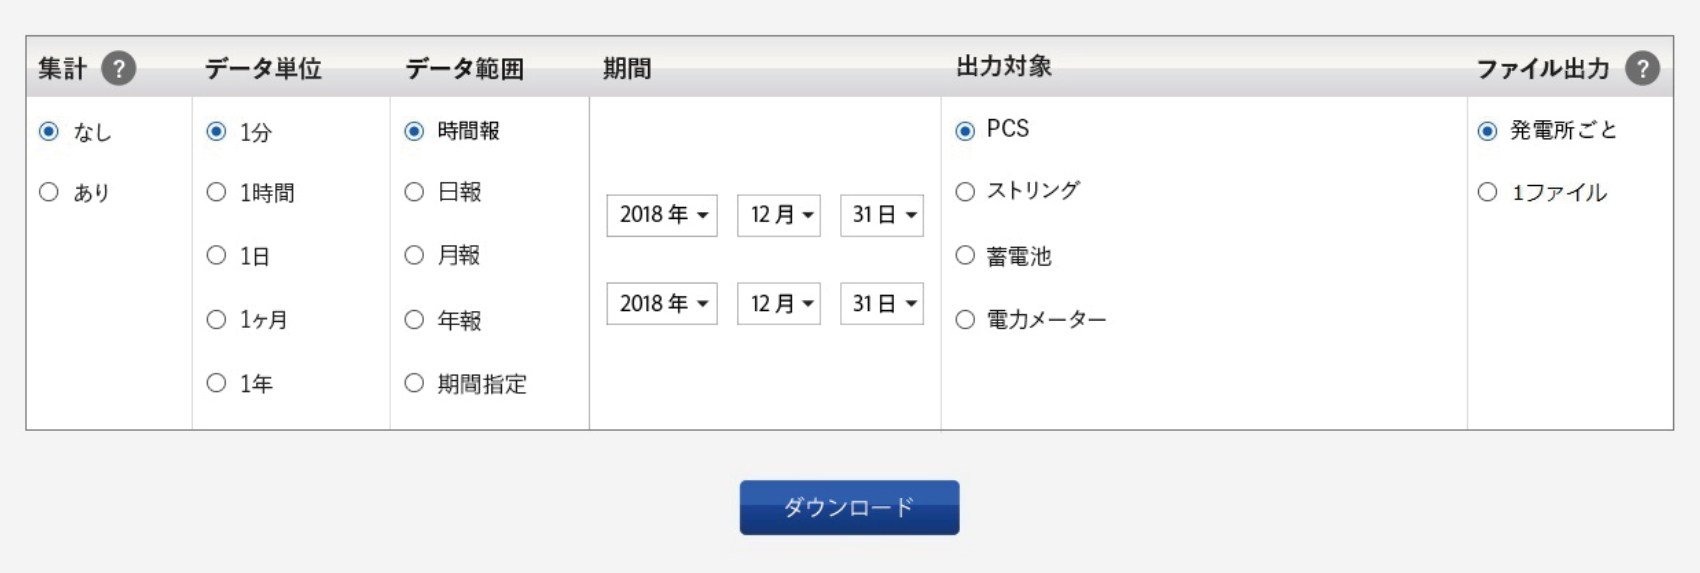
| Data Unit | 1 minute / 30 minutes / 1 hour / 1 day / 1 month / Track record |
|---|---|
| Data Range | Hourly report / Daily report / Monthly report / Annual report / Custom period |
| Measurement Targets | Inverter / String / Battery / Power Meter |
Report
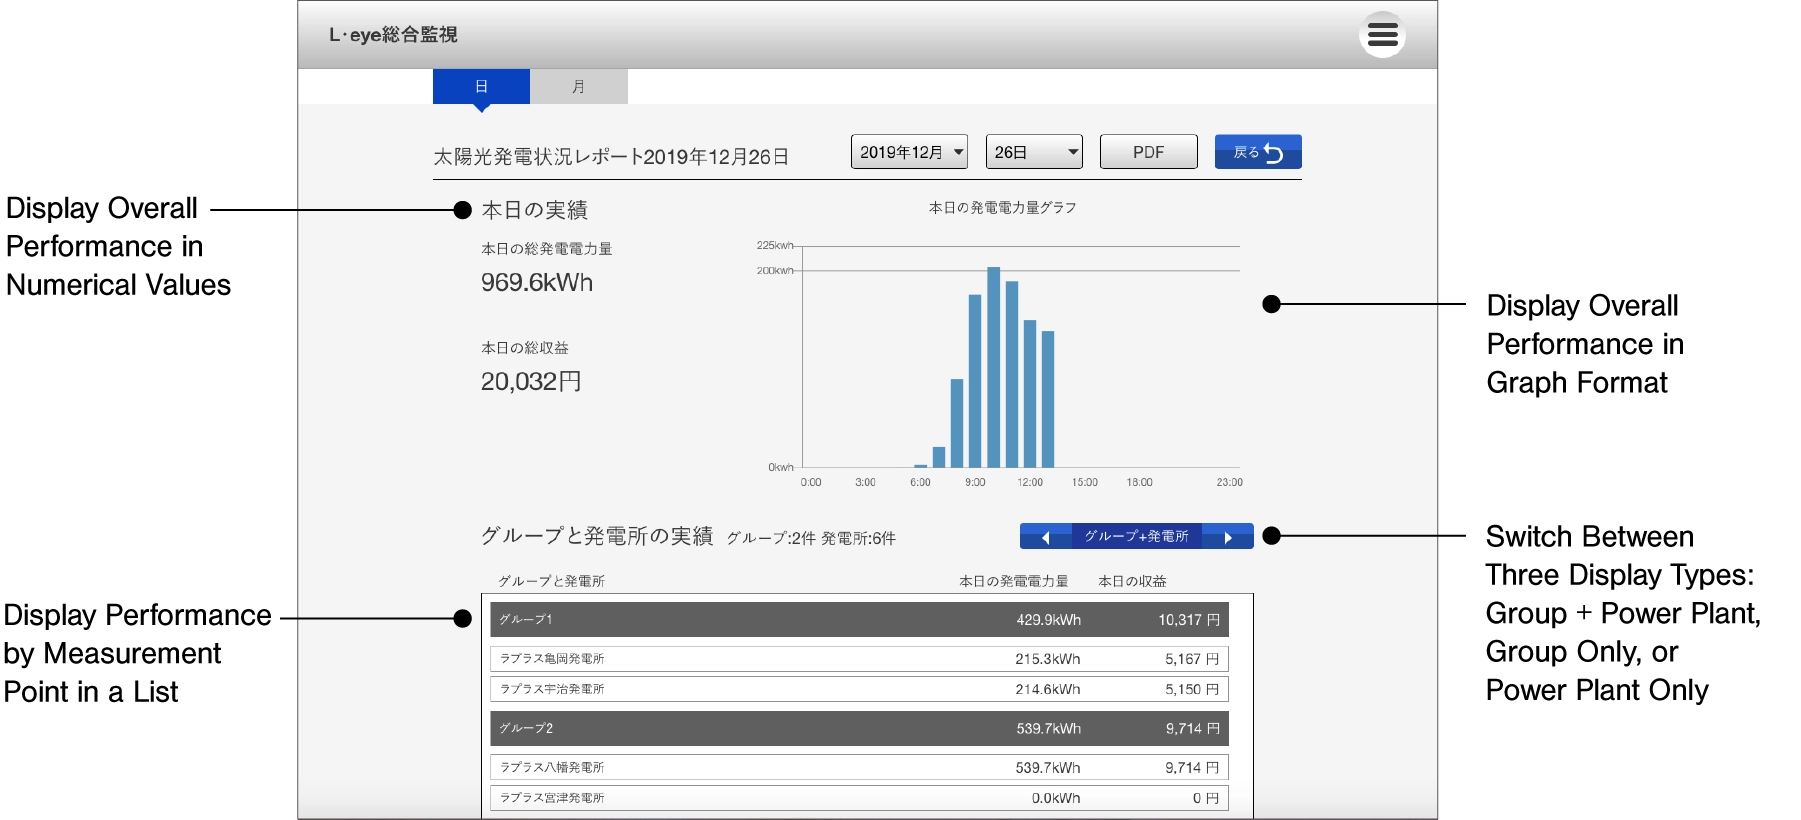
Displays daily and monthly aggregated results in a report format.
You can also download the reports in PDF format.
* It may take approximately 3 to 5 minutes to generate the report.
- Daily report
- Monthly report
- PDF Format
Edit & Settings
Customize Monitoring Freely with the Edit Function
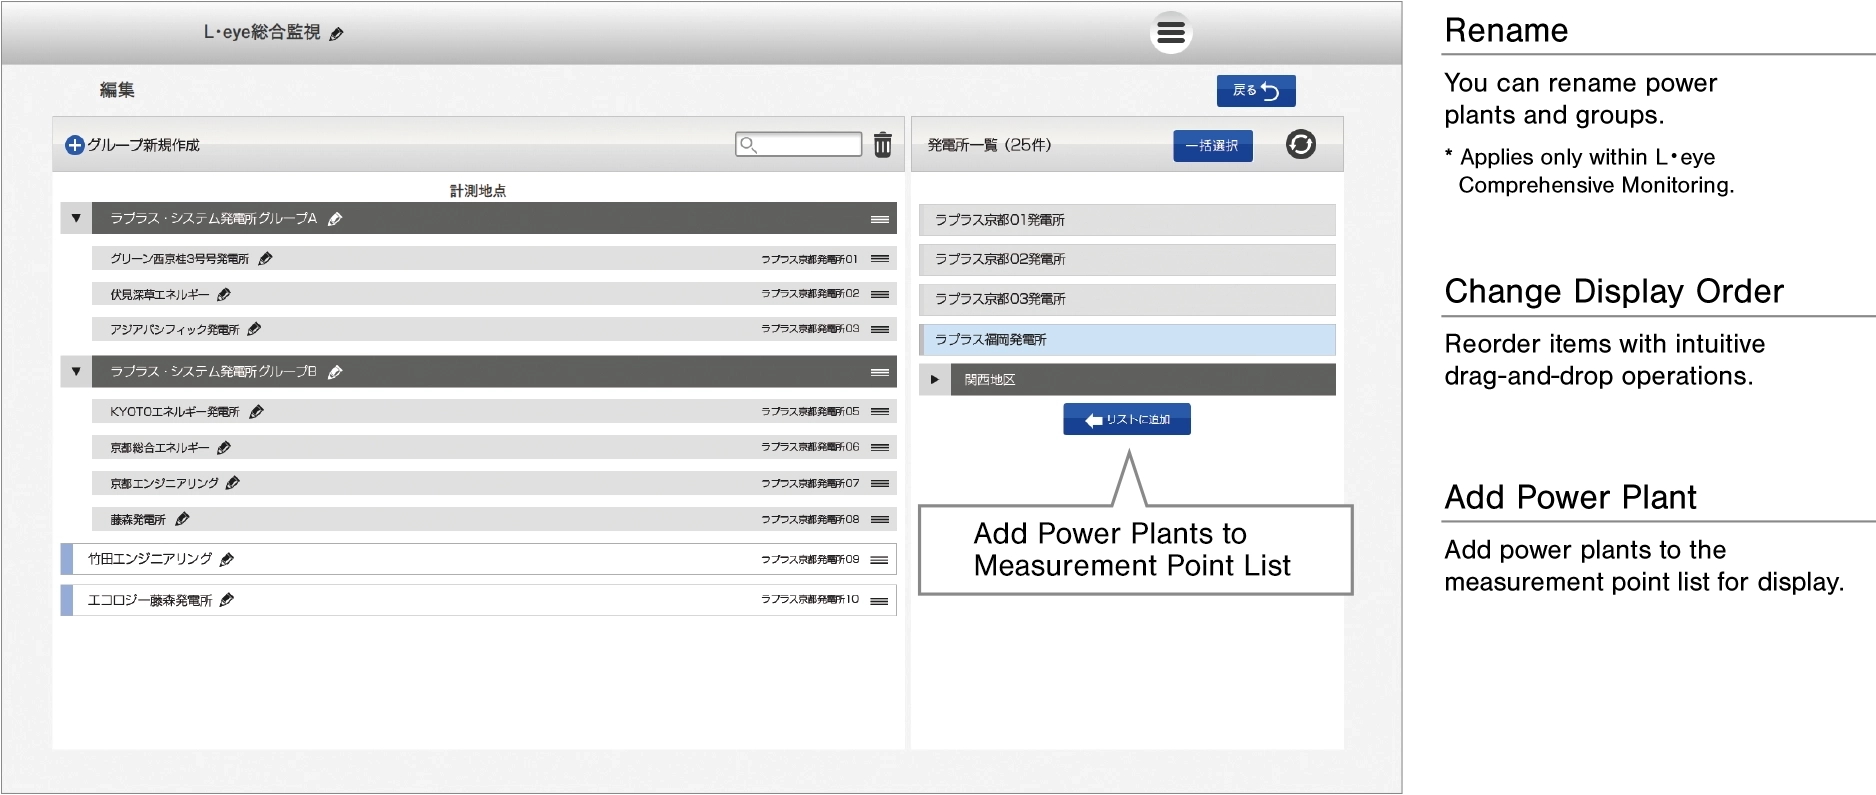
You can freely edit settings such as creating groups and setting names to suit your specific monitoring needs.
Power Plant / Group Editing
You can edit the composition of power plants and groups displayed in the measurement point list.
You can create new groups, rearrange the order, and rename them.
- Name
- Display Order
- Group
Coefficient / Display Item Settings
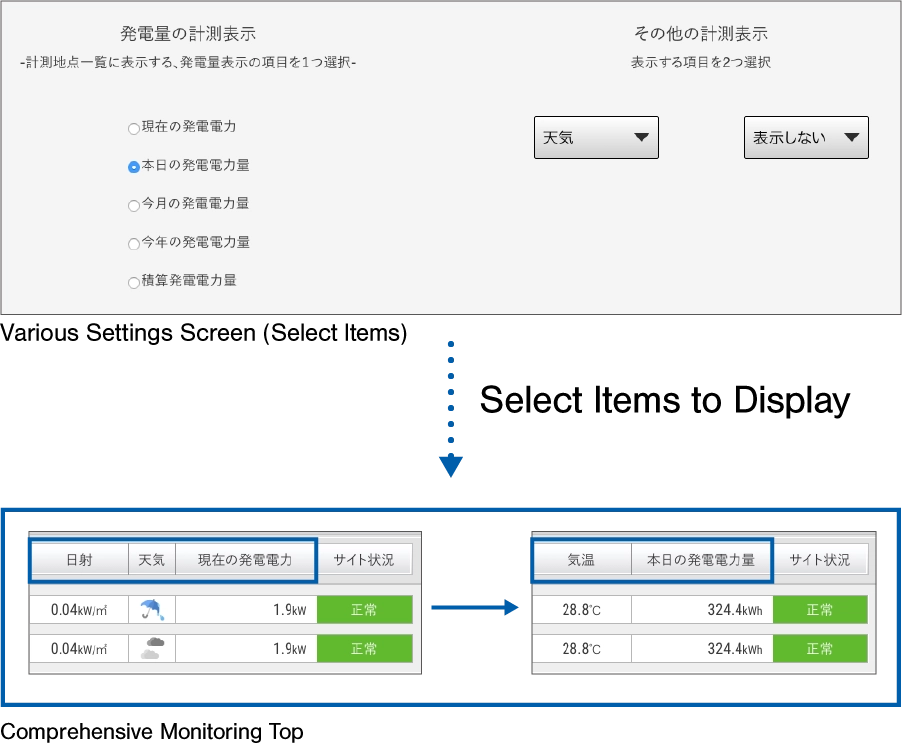
In the settings screen, you can change the display items shown in the measurement point list,
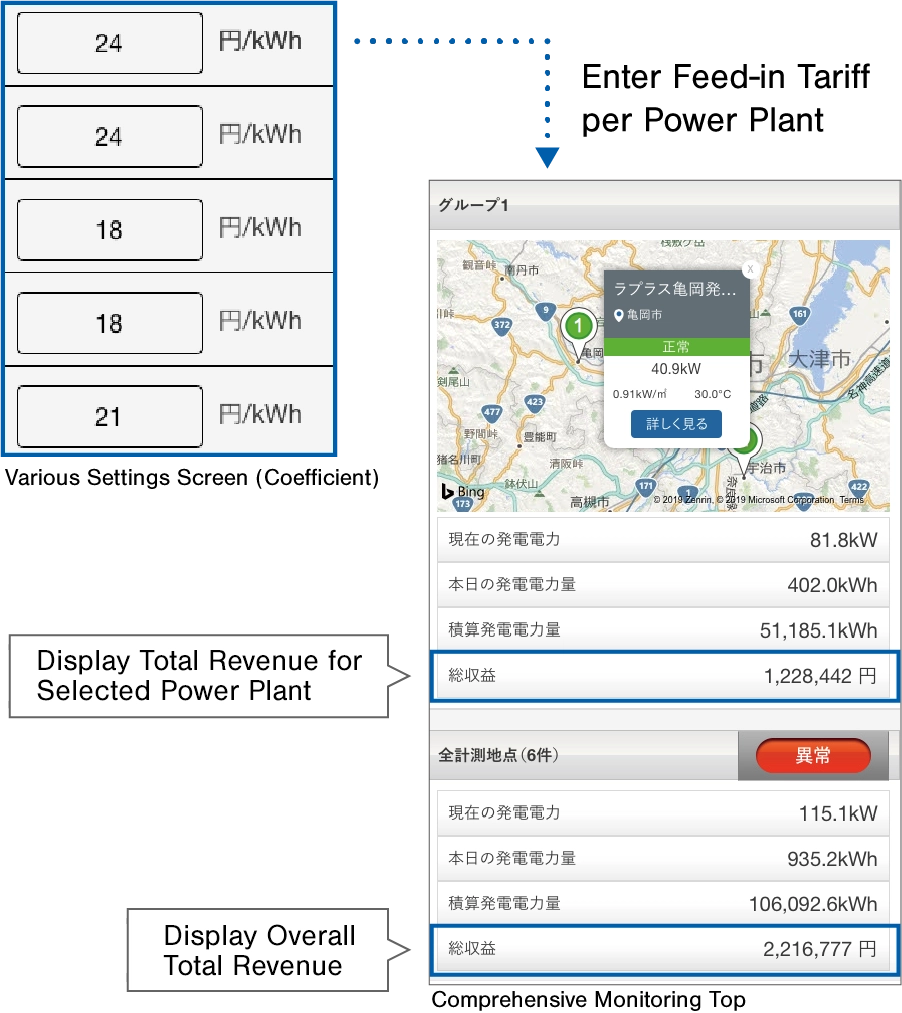
as well as set coefficients for displaying revenue from power sales.
- Coefficient Settings
- Display Item Changes
Display Total Revenue with Coefficient Settings
By setting the power selling price as a coefficient for each power plant, you can display total revenue.
Changing Display Items
In addition to power generation amount, you can select and display up to two additional measurement items.
Operating environment
PC
We do not guarantee proper operation in environments other than those listed below.
| Supported OS | Windows 11 |
|---|---|
| Supported Web Browsers | Microsoft Edge / Google Chrome / Mozilla Firefox(Both are the latest versions) * Graph screens may not display correctly on browsers other than those listed above. |
| Screen Resolution | Recommended: 1920 x 1080 pixels or higher (Also usable with: 1280 x 1024 pixels / 1024 x 768 pixels) |
